
Magnitude takes you to areas hit by an earthquake greater than 2.0ml. Earthquake data are taken from INGV: © ISIDe Working Group (INGV, 2010), and from USG: United States Geological Survey.
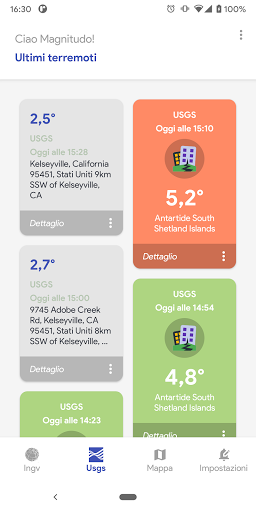
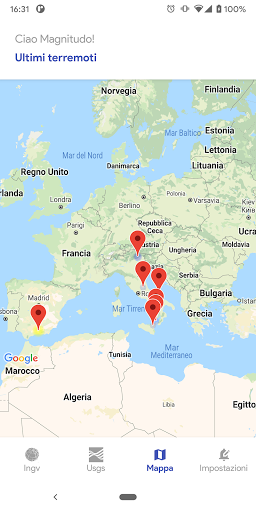
Each earthquake is displayed on the map according to a scale indicated by a color representative of the intensity of the earthquake.
Scale radar:
- blue Ml less than 2.5
- yellow Ml between 2.5 and 4.5
- Orange Ml between 4.5 and 5.9
- red Ml greater than 5.9
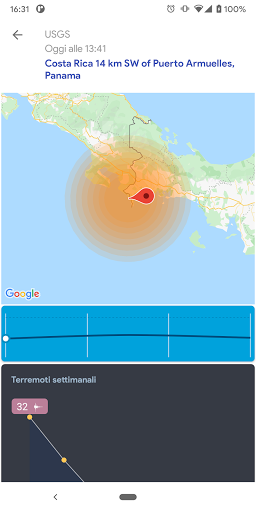
Earthquakes are broken down by provider and listed as a list. Each earthquake, if clicked, leads to an analysis section that shows the place on a map.
Upgrade to Android 11


9Apps 4.9


