


All high quality mobile apps are available for free download. 20,000+ users downloaded GraphicalGW latest version on 9Apps for free every week! The world's most powerful app is here waiting for you. This hot app was released on 2019-01-27. Find out more android software you're looking for at 9apps.com
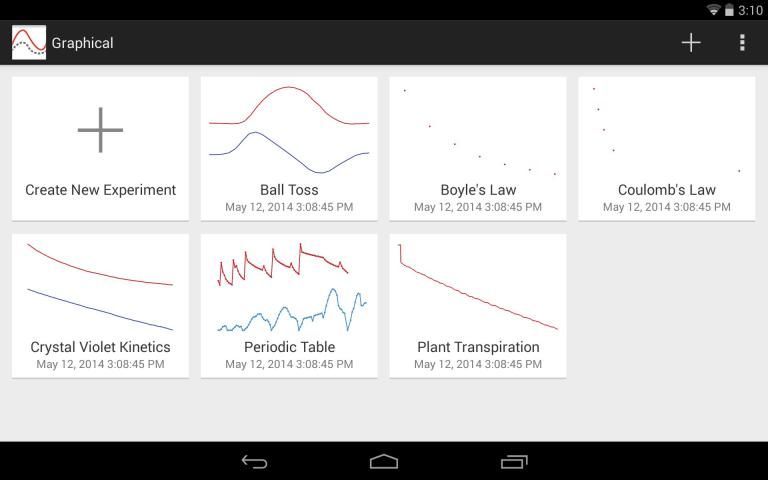
Graphical Analysis™ GW is a tool for science students to collect, graph, and analyze data from Vernier Go Wireless® sensors.
Sensor data-collection support:
• Vernier Go Wireless® Temp and Go Wireless pH sensors
• Vernier Go Wireless Heart Rate and Go Wireless Exercise Heart Rate monitors
• Vernier LabQuest® sensors used with Go Wireless Link or LabQuest Stream interfaces
Additional experiment options:
• Data Sharing via Wi-Fi connection to LabQuest 2 or Logger Pro® 3
• Built-in Sensors (accelerometers)
• Manual Entry
Note: Sensor data collection and Data Sharing require the purchase of hardware from Vernier Software & Technology. Built-in sensor and manual entry of data can be performed without a hardware purchase. For more information on Data Sharing, visit http://www.vernier.com/css
Key Features - Data Collection
• Multi-sensor data-collection support (requires LabQuest Stream)
• Time Based, Event Based data-collection modes
• Configurable data-collection rate and duration for time-based data collection
• Option to zero sensor readings
• Manual entry of data from keyboard and clipboard
Key Features - Data Analysis
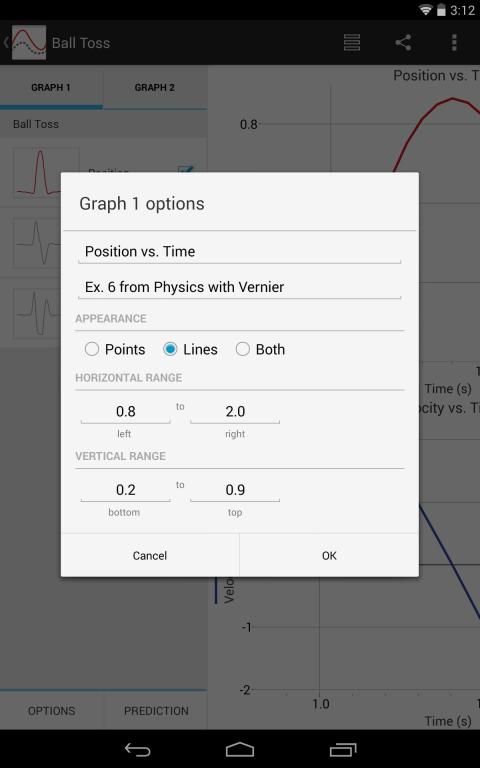
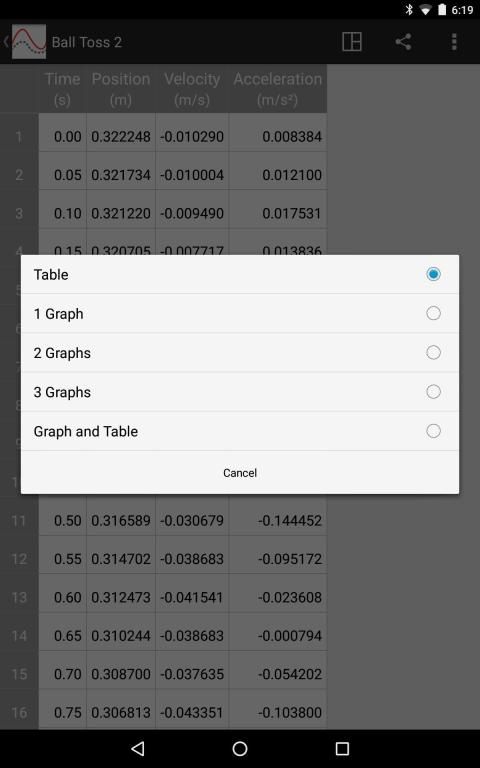
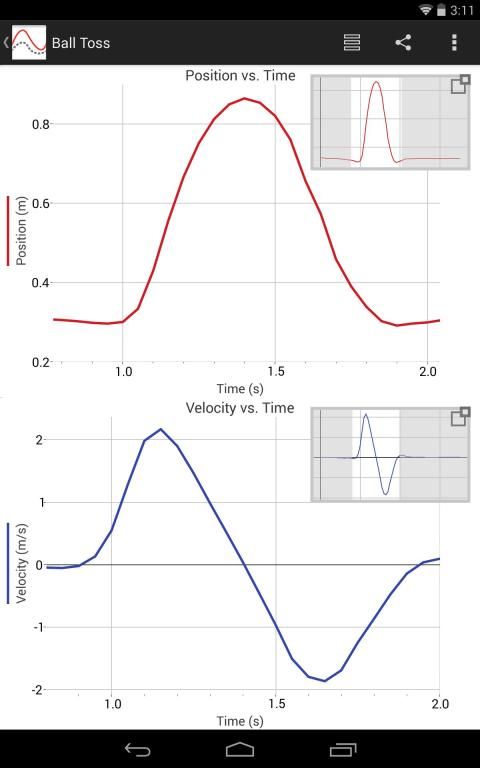
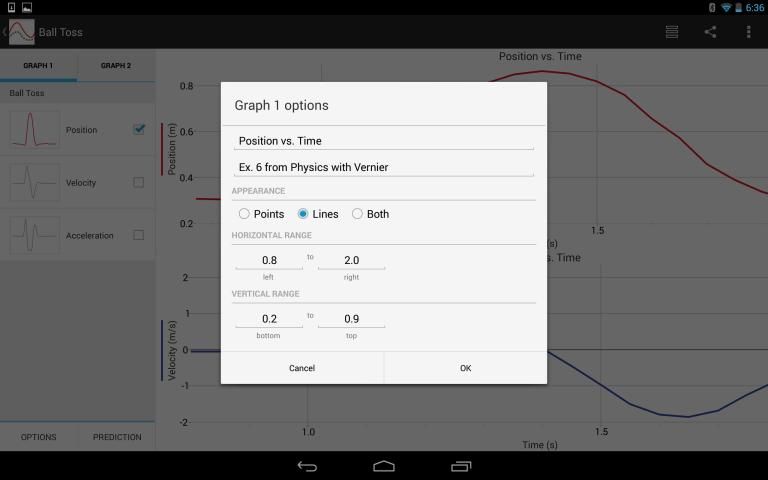
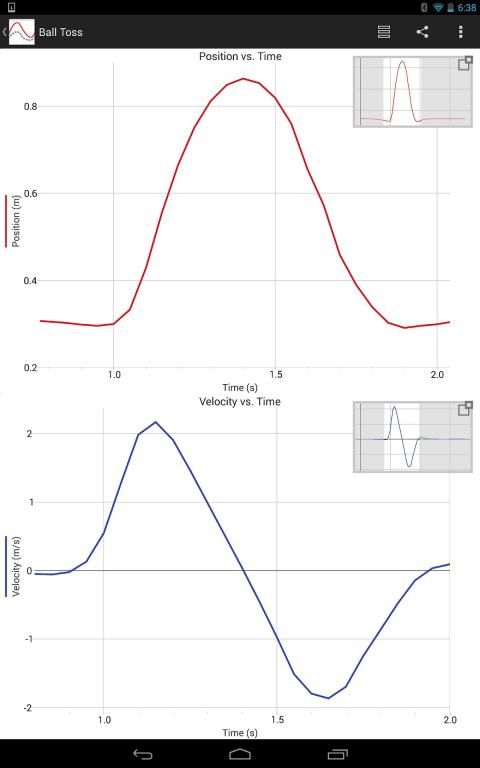
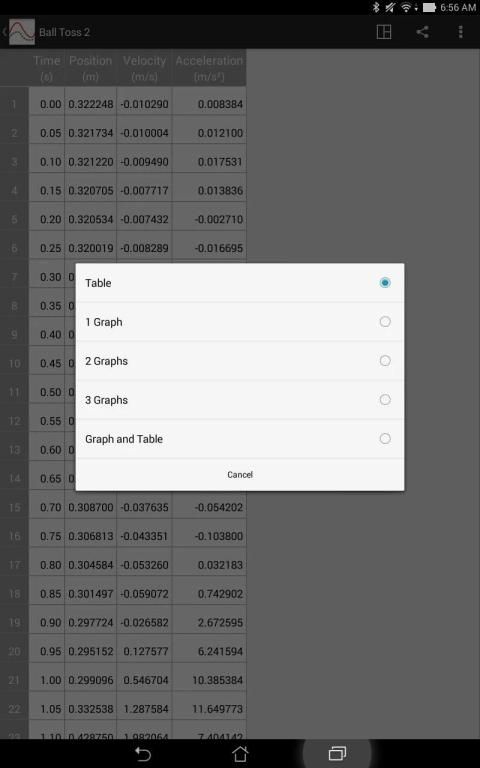
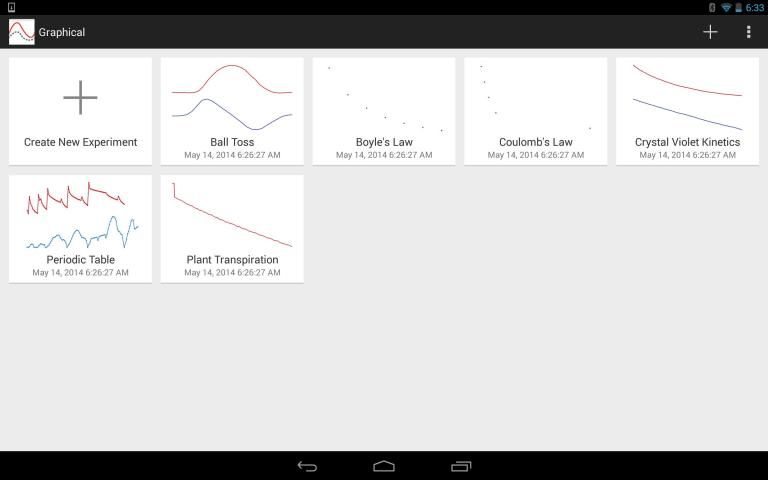
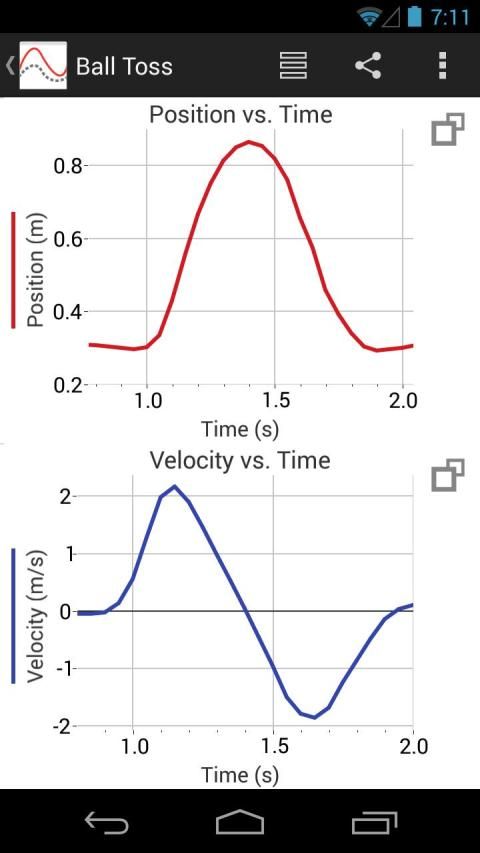
• Display one, two, or three graphs simultaneously
• View data in a table or show a graph and table side-by-side
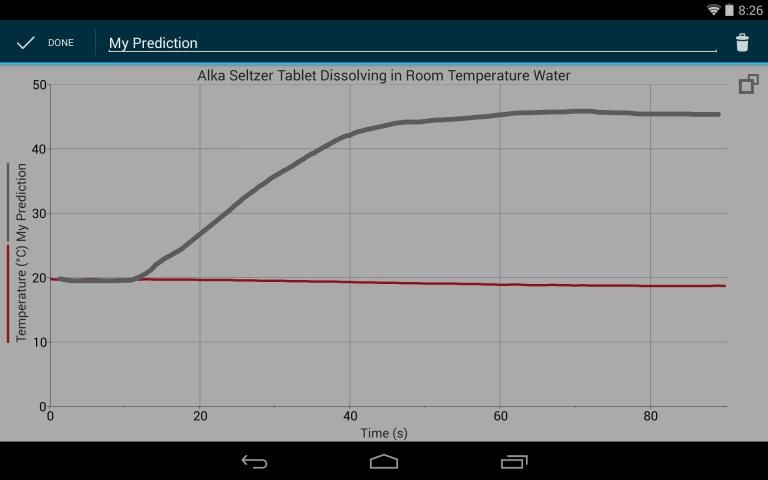
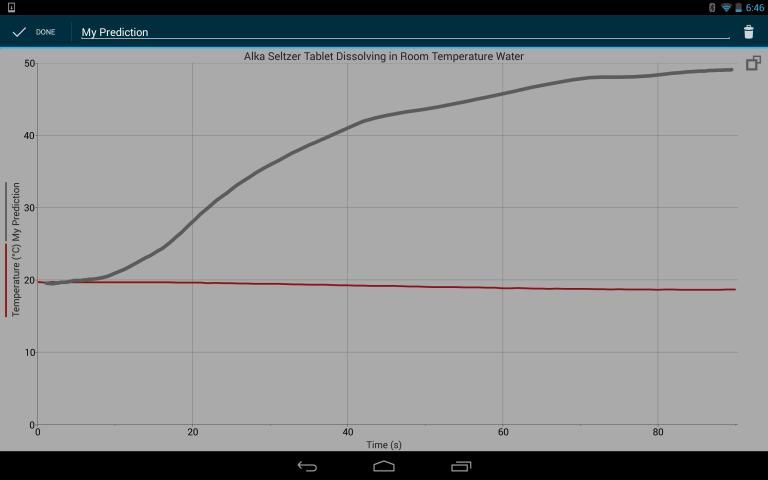
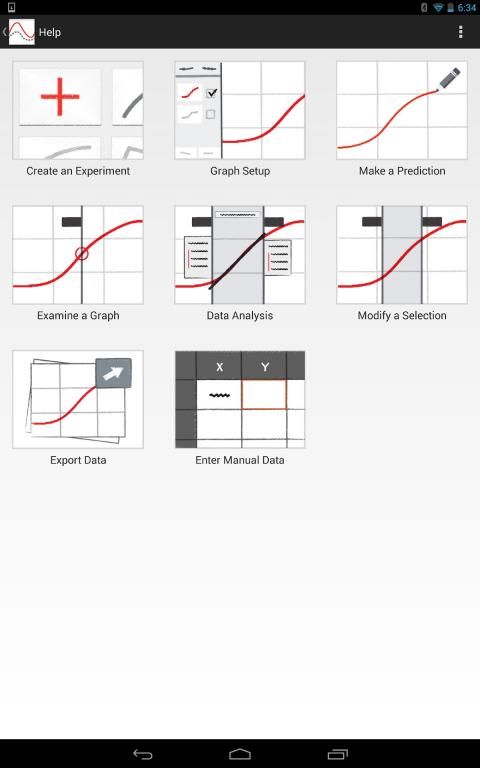
• Draw Predictions on a graph to uncover misconceptions
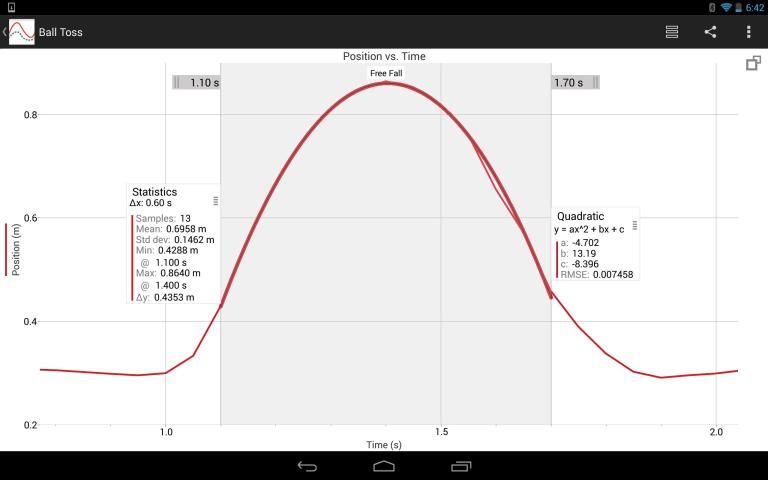
• Examine and select data
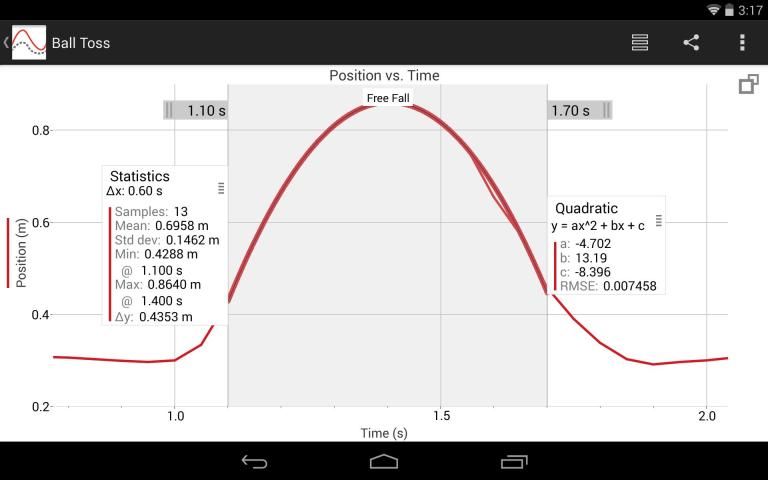
• Apply Statistics calculations to find mean, min, max, and standard deviation
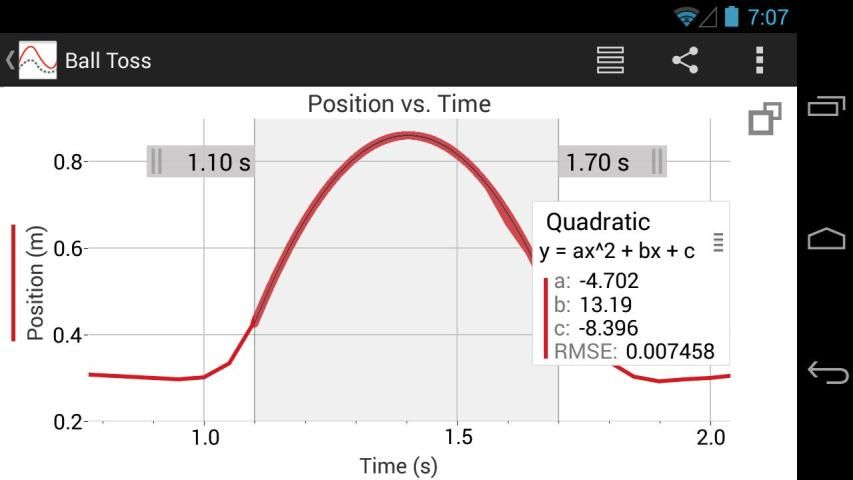
• Perform curve fits, including linear, quadratic, natural exponent, and more
• Pinch to scale graphs
Key Features - Collaboration and Sharing
• Create text annotations and add graph titles
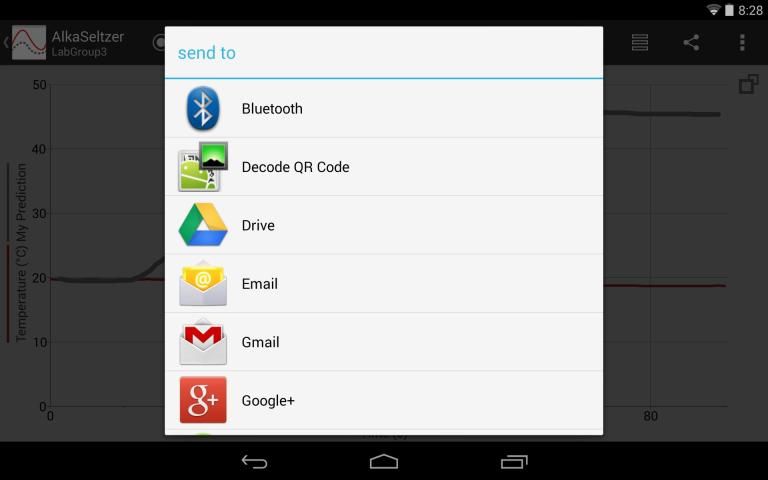
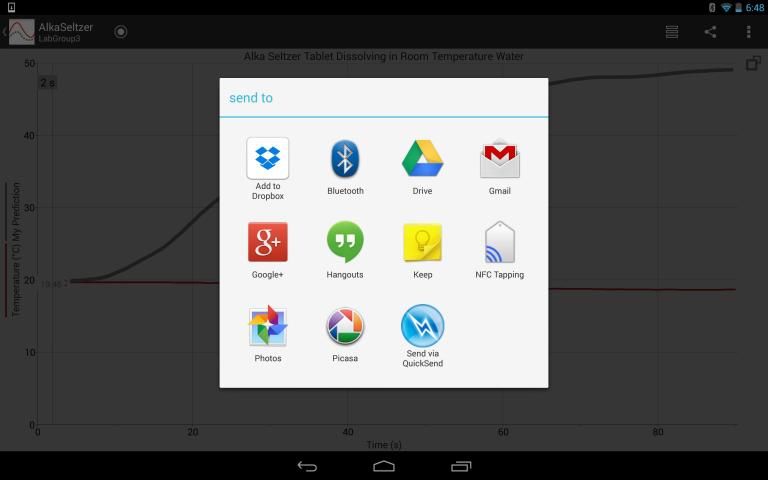
• Export graphs and data for printing and inclusion in lab reports
• Export data in .CSV format for analysis of data in spreadsheet software such as Excel®, Google Sheets™, and Numbers®
Note: The above features apply to version 3.2 only, available for devices running Android OS version 4.3 or newer. Android devices running OS versions 4.1-4.22 will receive Graphical Analysis version 1.2, which only supports Data Sharing, Built-in Sensors, and Manual Entry experiments.
Vernier Software & Technology has over 35 years of experience in providing effective learning resources for understanding experimental data in science and math classrooms. Graphical Analysis GW is a part of the extensive system of sensors, interfaces, and data-collection software from Vernier for science and STEM education.
चित्रमय विश्लेषण ™ गिनीकृमि, इकट्ठा करने के लिए ग्राफ, और वर्नियर जाओ Wireless® सेंसरों से डेटा का विश्लेषण विज्ञान के छात्रों के लिए एक उपकरण है।
सेंसर डाटा संग्रह का समर्थन:
• वर्नियर जाओ Wireless® अस्थायी और जाओ वायरलेस पीएच सेंसर
• वर्नियर जाओ वायरलेस हृदय गति और जाओ वायरलेस व्यायाम हृदय गति पर नज़र रखता है
• वर्नियर LabQuest® साथ जाओ वायरलेस लिंक या LabQuest स्ट्रीम इंटरफेस का इस्तेमाल किया सेंसर
अतिरिक्त प्रयोग विकल्प:
• LabQuest 2 या लॉगर प्रो ® से 3 वाई-फाई कनेक्शन के माध्यम से डाटा शेयरिंग
• में निर्मित सेंसर (accelerometers)
• हस्त प्रविष्टि
नोट: सेंसर डेटा संग्रह और डाटा शेयरिंग वर्नियर सॉफ्टवेयर और प्रौद्योगिकी से हार्डवेयर की खरीद की आवश्यकता है। निर्मित सेंसर और डेटा के मैनुअल प्रविष्टि एक हार्डवेयर खरीद के बिना किया जा सकता है। डाटा शेयरिंग के बारे में अधिक जानकारी के लिए देखें http://www.vernier.com/css
मुख्य विशेषताएं - डेटा संग्रह
• मल्टी सेंसर डाटा-संग्रह का समर्थन (की आवश्यकता है LabQuest स्ट्रीम)
• समय आधार पर, ईवेंट आधारित डाटा संग्रह मोड
• विन्यास डाटा संग्रह दर और अवधि समय आधारित डेटा संग्रह के लिए
• विकल्प को शून्य सेंसर रीडिंग
• कीबोर्ड और क्लिपबोर्ड से डेटा के मैनुअल प्रविष्टि
मुख्य विशेषताएं - डेटा विश्लेषण
• प्रदर्शन एक, दो, या तीन रेखांकन एक साथ
• किसी तालिका में डेटा देखें या एक ग्राफ और टेबल साइड-बाई-साइड दिखाने
• गलत धारणाओं को उजागर करने के लिए एक ग्राफ पर भविष्यवाणियों ड्रा
• जांच करना और डेटा का चयन
• मतलब, न्यूनतम, अधिकतम, और मानक विचलन को खोजने के लिए सांख्यिकी गणना लागू करें
• रैखिक, द्विघात, प्राकृतिक प्रतिपादक सहित वक्र फिट, प्रदर्शन, और अधिक
• रेखांकन नापने के लिए पिंच
मुख्य विशेषताएं - सहयोग और साझा
• पाठ व्याख्या बनाएँ और ग्राफ शीर्षक जोड़ने
• निर्यात रेखांकन और मुद्रण और प्रयोगशाला की रिपोर्ट में शामिल करने के लिए डेटा
• इस तरह के Excel® के रूप में स्प्रेडशीट सॉफ्टवेयर में डेटा के विश्लेषण के लिए .csv प्रारूप में डेटा, Google शीट ™, और Numbers® निर्यात
नोट: उपरोक्त सुविधाओं, उपलब्ध चल Android ओएस संस्करण 4.3 या नए उपकरणों के लिए संस्करण 3.2 केवल करने के लिए लागू होते हैं। Android OS संस्करणों 4.1-4.22 चलाने वाले उपकरणों ग्राफिकल विश्लेषण संस्करण 1.2 है, जो केवल डाटा शेयरिंग का समर्थन करता है, में निर्मित सेंसर, और मैन्युअल प्रविष्टि प्रयोगों प्राप्त होगा।
वर्नियर सॉफ्टवेयर और प्रौद्योगिकी विज्ञान और गणित कक्षाओं में प्रयोगात्मक डेटा को समझने के लिए प्रभावी शिक्षण संसाधन उपलब्ध कराने में अनुभव के वर्षों 35 से अधिक है। चित्रमय विश्लेषण गिनीकृमि सेंसर, इंटरफेस, और डेटा-मेमोरी सॉफ्टवेयर वर्नियर से विज्ञान और स्टेम शिक्षा के लिए की व्यापक प्रणाली का एक हिस्सा है।
updated translations
9Apps 4.9


