
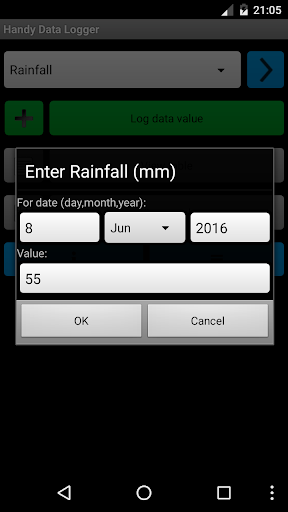

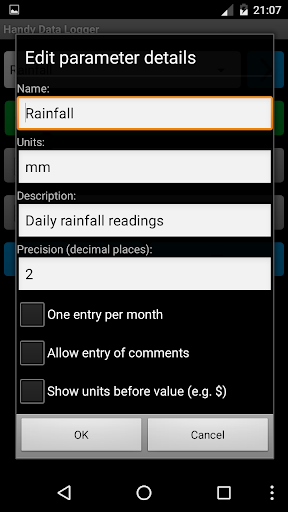
This app can act as a rainfall chart to use with your rain gauge. You can also use it to record other daily or monthly data values such as sales, body weight, temperature, etc. It allows you to set up a number of different parameters that you want to record, and then easily enter numeric values each day or month. You can also import data from and export data to comma delimited (CSV) text files.
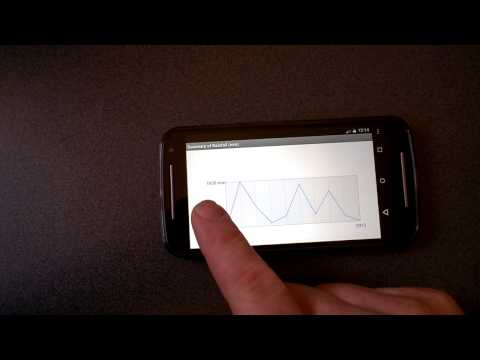
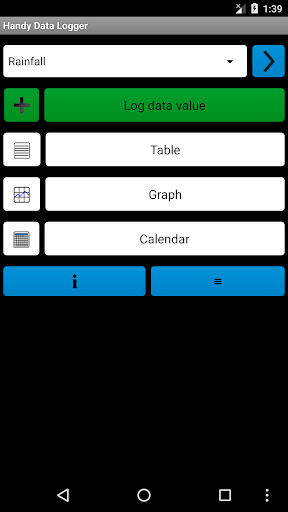
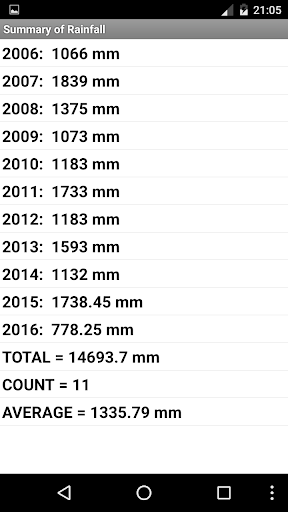
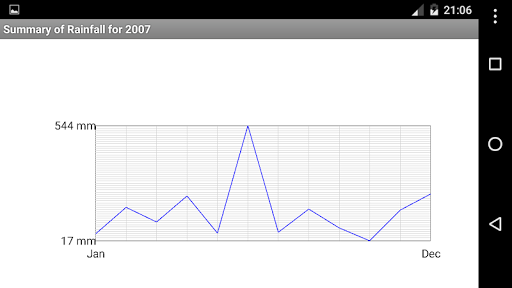
Once you have recorded data, you can view it in tabular, calendar, or graphical form. Data can be viewed for a given month, year, or all years. The graph can display the data as a line or bar chart, and a linear trend line can optionally be shown over the top.
Note: When importing from a CSV file, the format should be the same as the files the app exports.
3.8: Updated to target SDK 29 as required by Google.
3.7: Show totals on table page even if no entries. Bug fix for calendar page.
3.6: If entries have comments, show them on table view, and indicate them with an asterix on calendar view.
3.5: Improvements to calendar and graph pages.
3.4: Added an option to graph the monthly values for all years overlaid on one graph.
3.3: Improvements to graph page, including menu option to increase text size.


9Apps 4.9


